
Introduction
Running a business in the information age requires turning vast amounts of data into actionable insights. Integrating Power BI and Dynamics 365, two powerful Microsoft tools, addresses this challenge.
Power BI allows organizations to visualize data and make informed decisions, while Dynamics 365 CRM manages customer relationships, sales, and marketing. Together, these platforms help businesses derive valuable insights and enhance customer experiences.
This article will guide you through connecting Power BI to Microsoft Dynamics 365, showing how to extract data, model it in Power BI, and create impactful reports.
The Task
Imagine the task: your manager decided to start monitoring contact creation progress and you were asked to come up with a Power BI report that will always display the number of contacts created in the last 7 days.
In this example we are using an out-of-the-box Created On field, but in case your report will require a custom datetime field, we already have a post in our blog describing how to automatically populate custom DateTime field.
Prerequisites
Because we will be discussing the Power BI report creation based on Dynamics 365 CRM data, I’m assuming that you already have all necessary licenses and roles you need to use Power BI and D365. You will also need to install the Power BI Desktop app from the App Store.
After the Power BI Desktop application is installed, you need to run it and log in using your credentials.
Connect Power BI to Dataverse
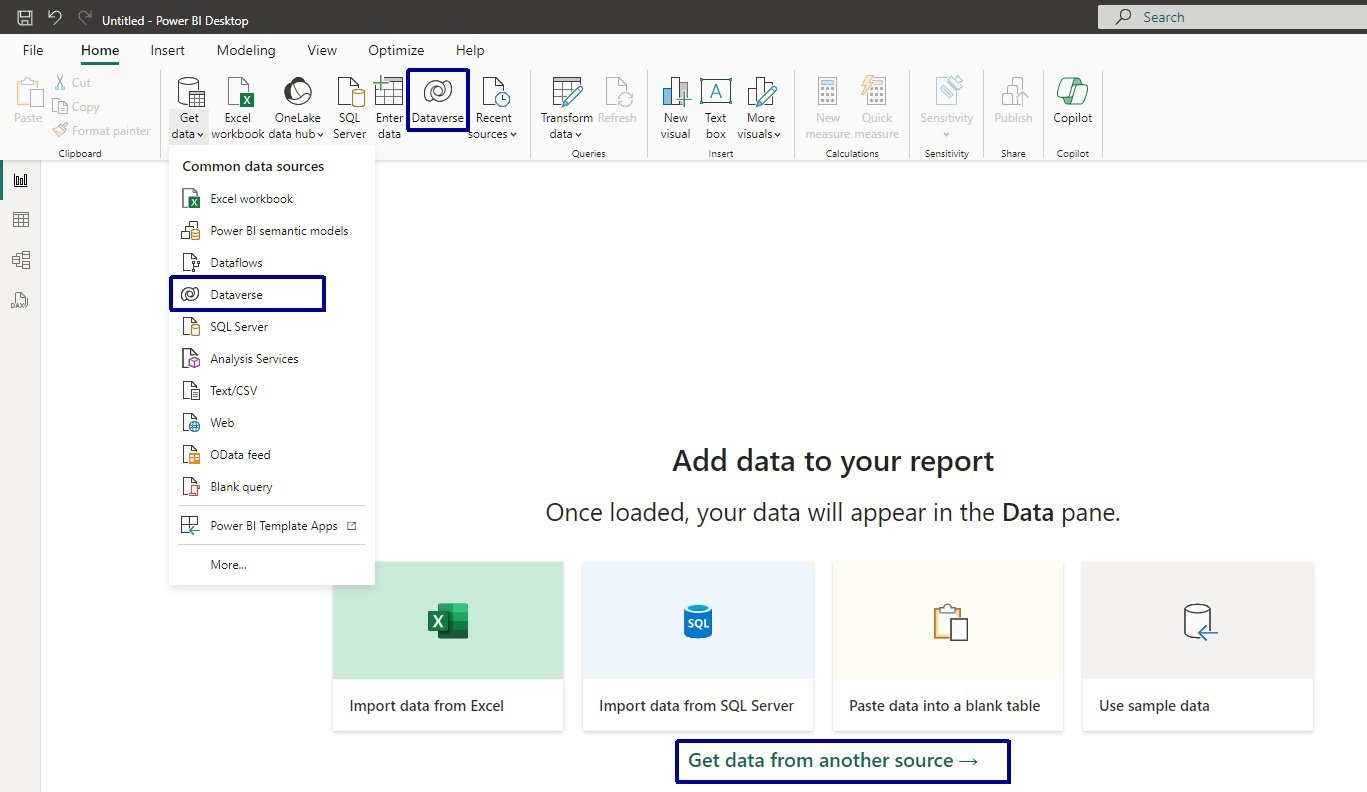
To get the data for Power BI report, first we need to specify the data source. In our case, it's Dynamics 365, so on any of the Dataverse options available, you can click on the "Get data from another source" option and select Dataverse.
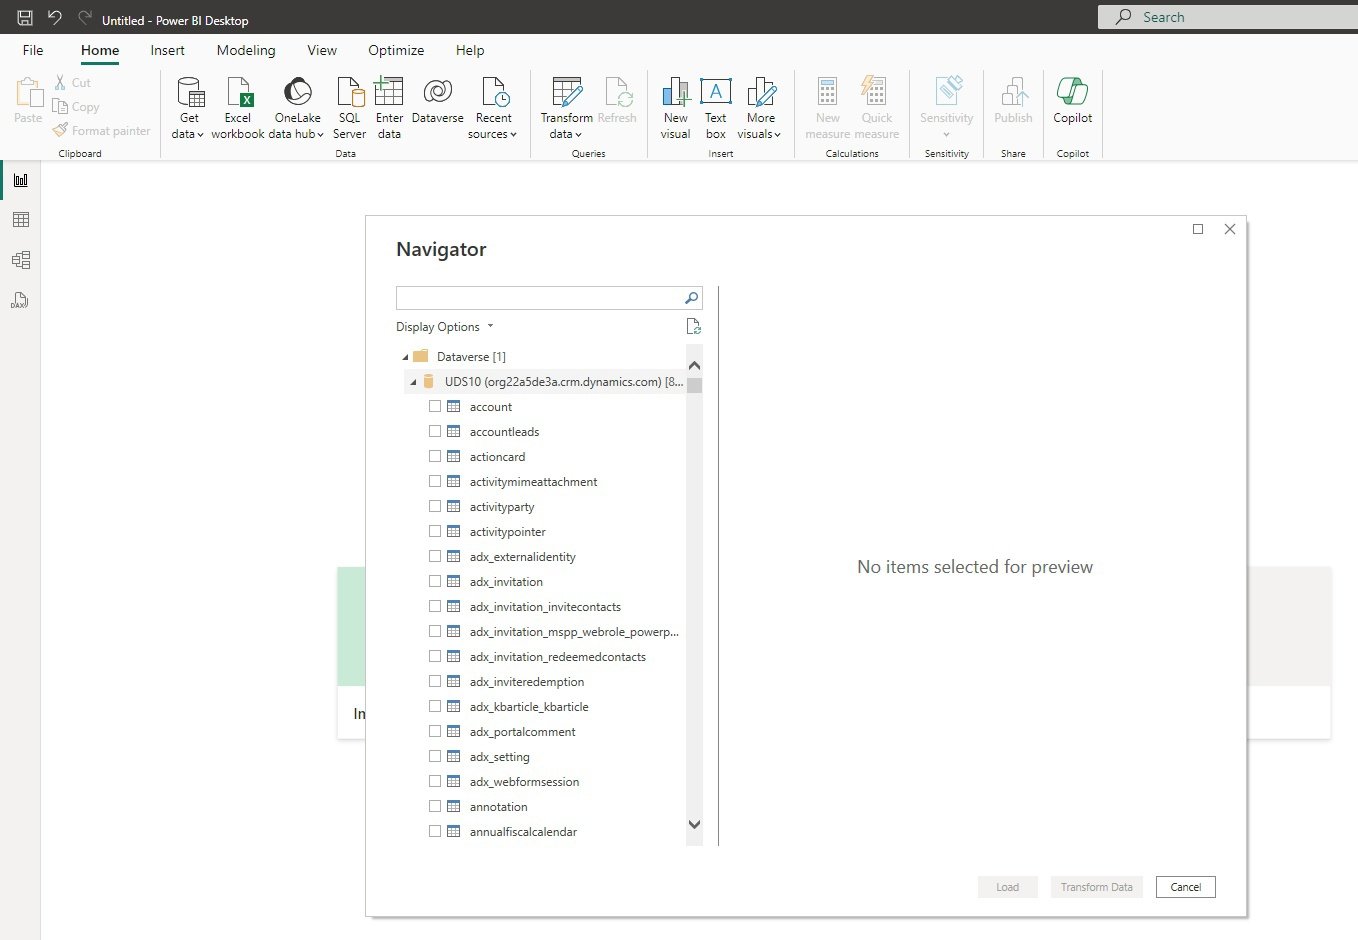
If your Power BI login was successful, your next window will be looking like this:
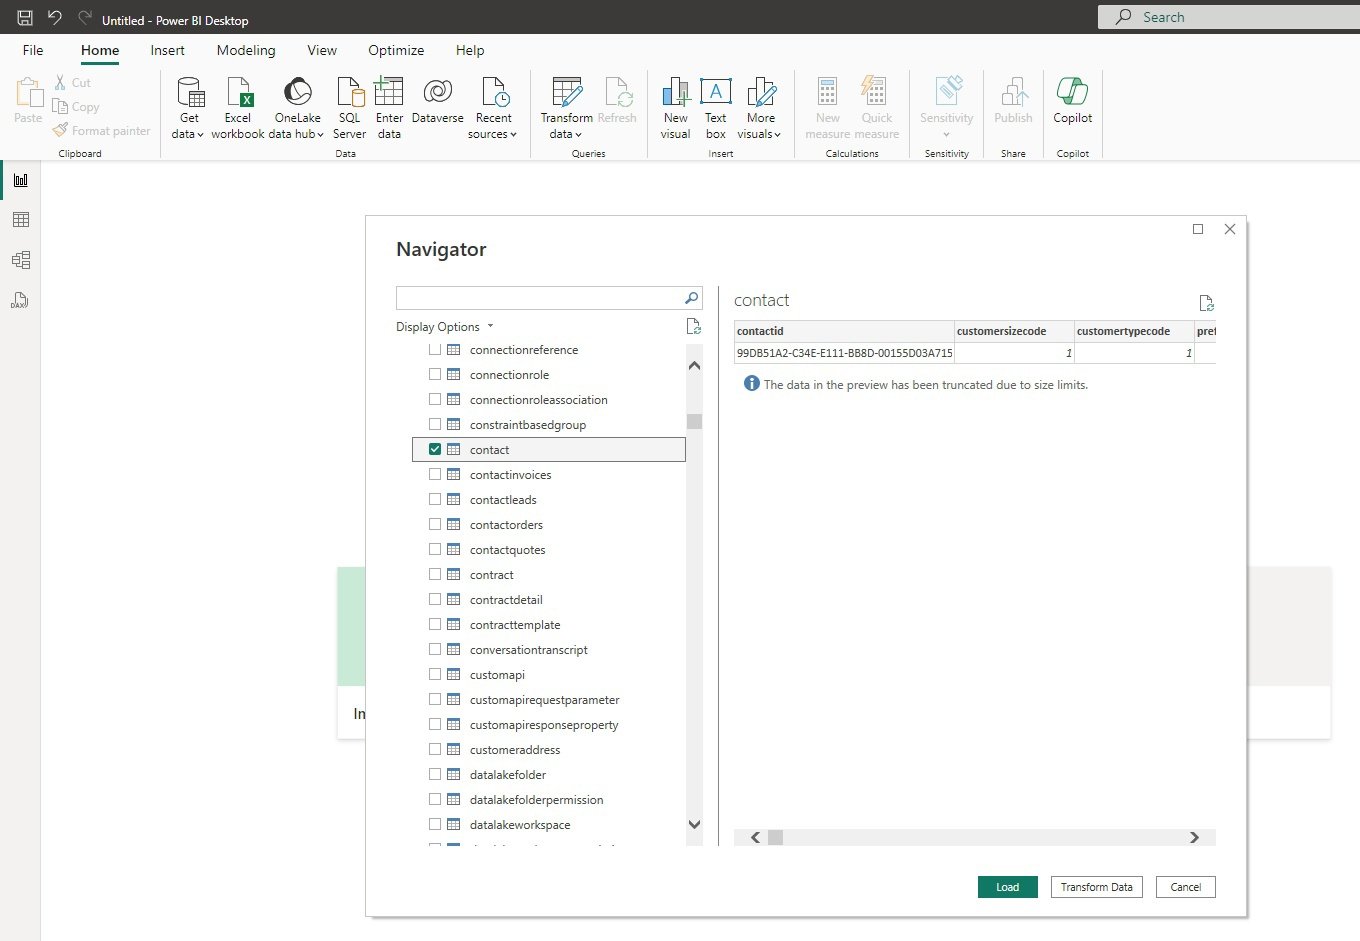
Because our report is based purely in the Contact entity data, you need to select the Contact checkbox and click on the Load button.
Next dialogue is an important one. It specifies the way your report will be interacting with data source.
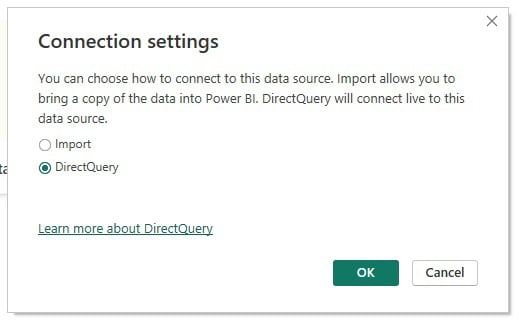
Before making this choice, you need to take a couple of things into consideration (text from learn.microsoft.com is quoted):
● Import: A copy of the data from the selected tables and columns imported into Power BI Desktop. As you create or interact with visualizations, Power BI Desktop uses the imported data. To see underlying data changes after the initial import or the most recent refresh, you must import the full semantic model again to refresh the data.
● DirectQuery: No data imports into Power BI Desktop. For relational sources, you can select tables and columns to appear in the Power BI Desktop Fields list. As you create or interact with visualizations, Power BI Desktop queries the underlying data source, so you're always viewing current data. The 1-GB semantic model limitation doesn't apply to DirectQuery.
Because your manager wants to monitor Contacts creation progress, Contact count should be close to reality every time a report is opened, so a DirectQuery option is more suitable in our case. After this option is selected click on the OK button and wait for the connection to be created.
Report Creation
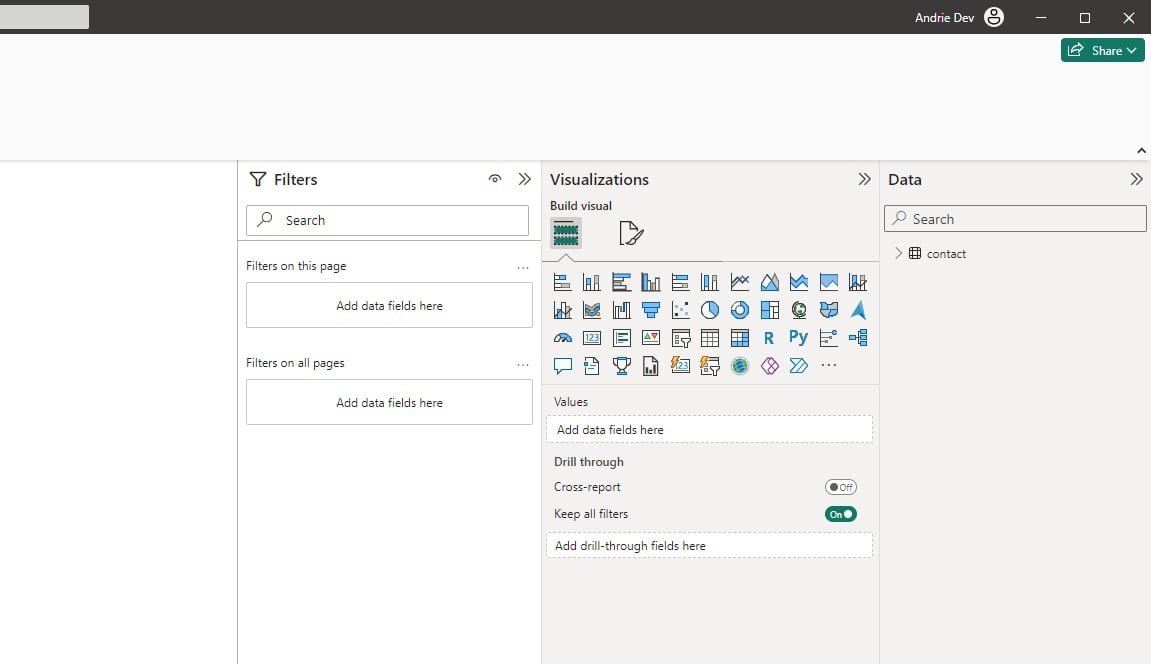
After a connection is created the right side of your Power BI Desktop will look like this. If one of the columns is not visible (or if you want to close the column), just click on the chevron icon after the column name.
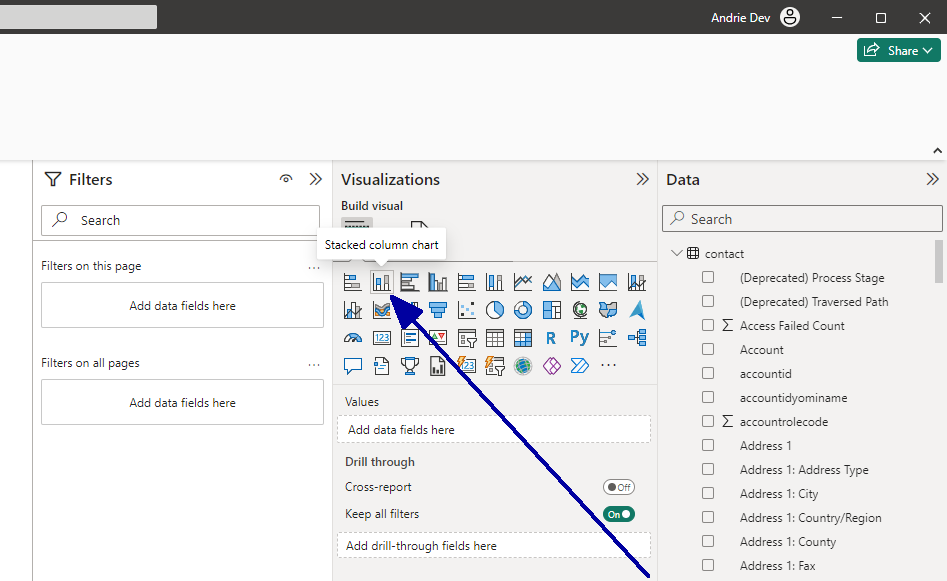
Now let’s create a Stacked column chart to count Contacts by clicking on the “Stacked column chart” option on the Visualization column.
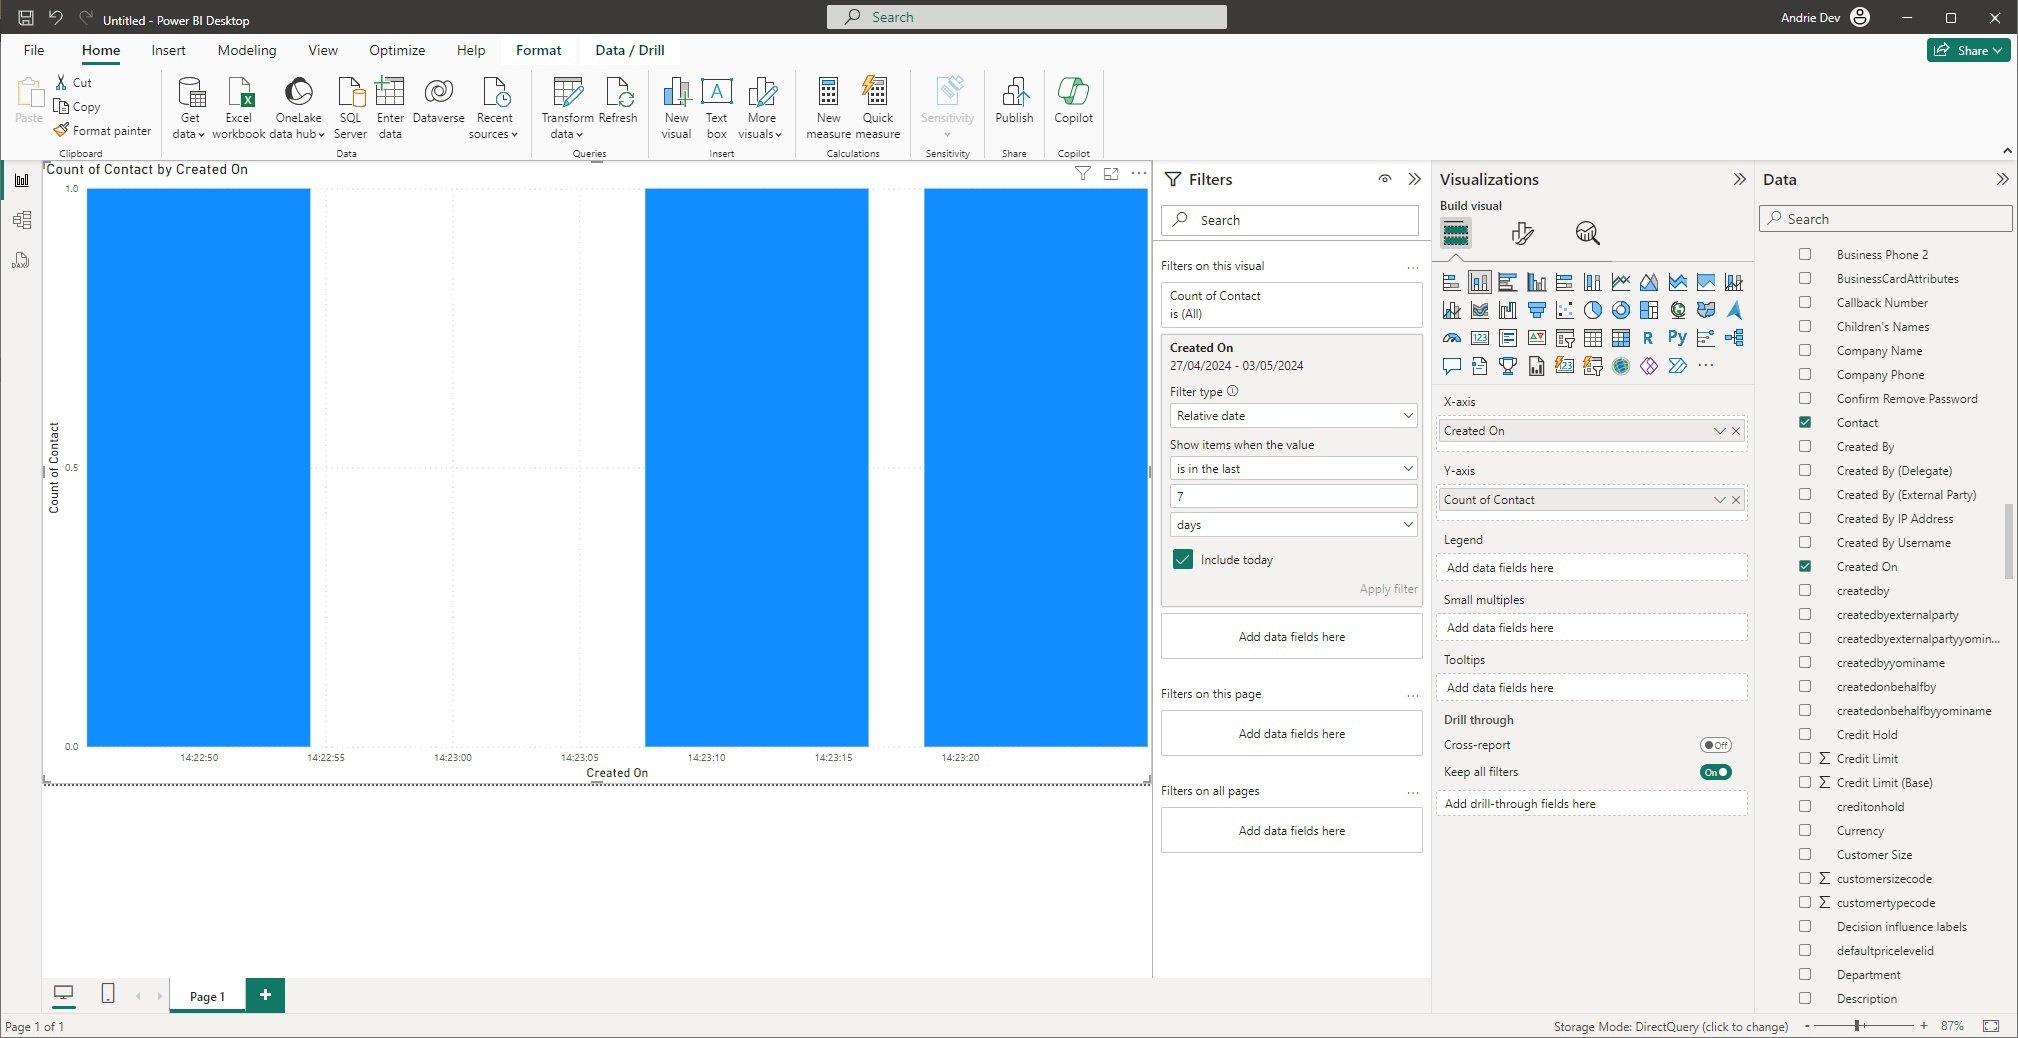
After expanding the chart in the report area, adding Created On field to the X-axis and Contact count to the Y-axis, your report should be looking like this.
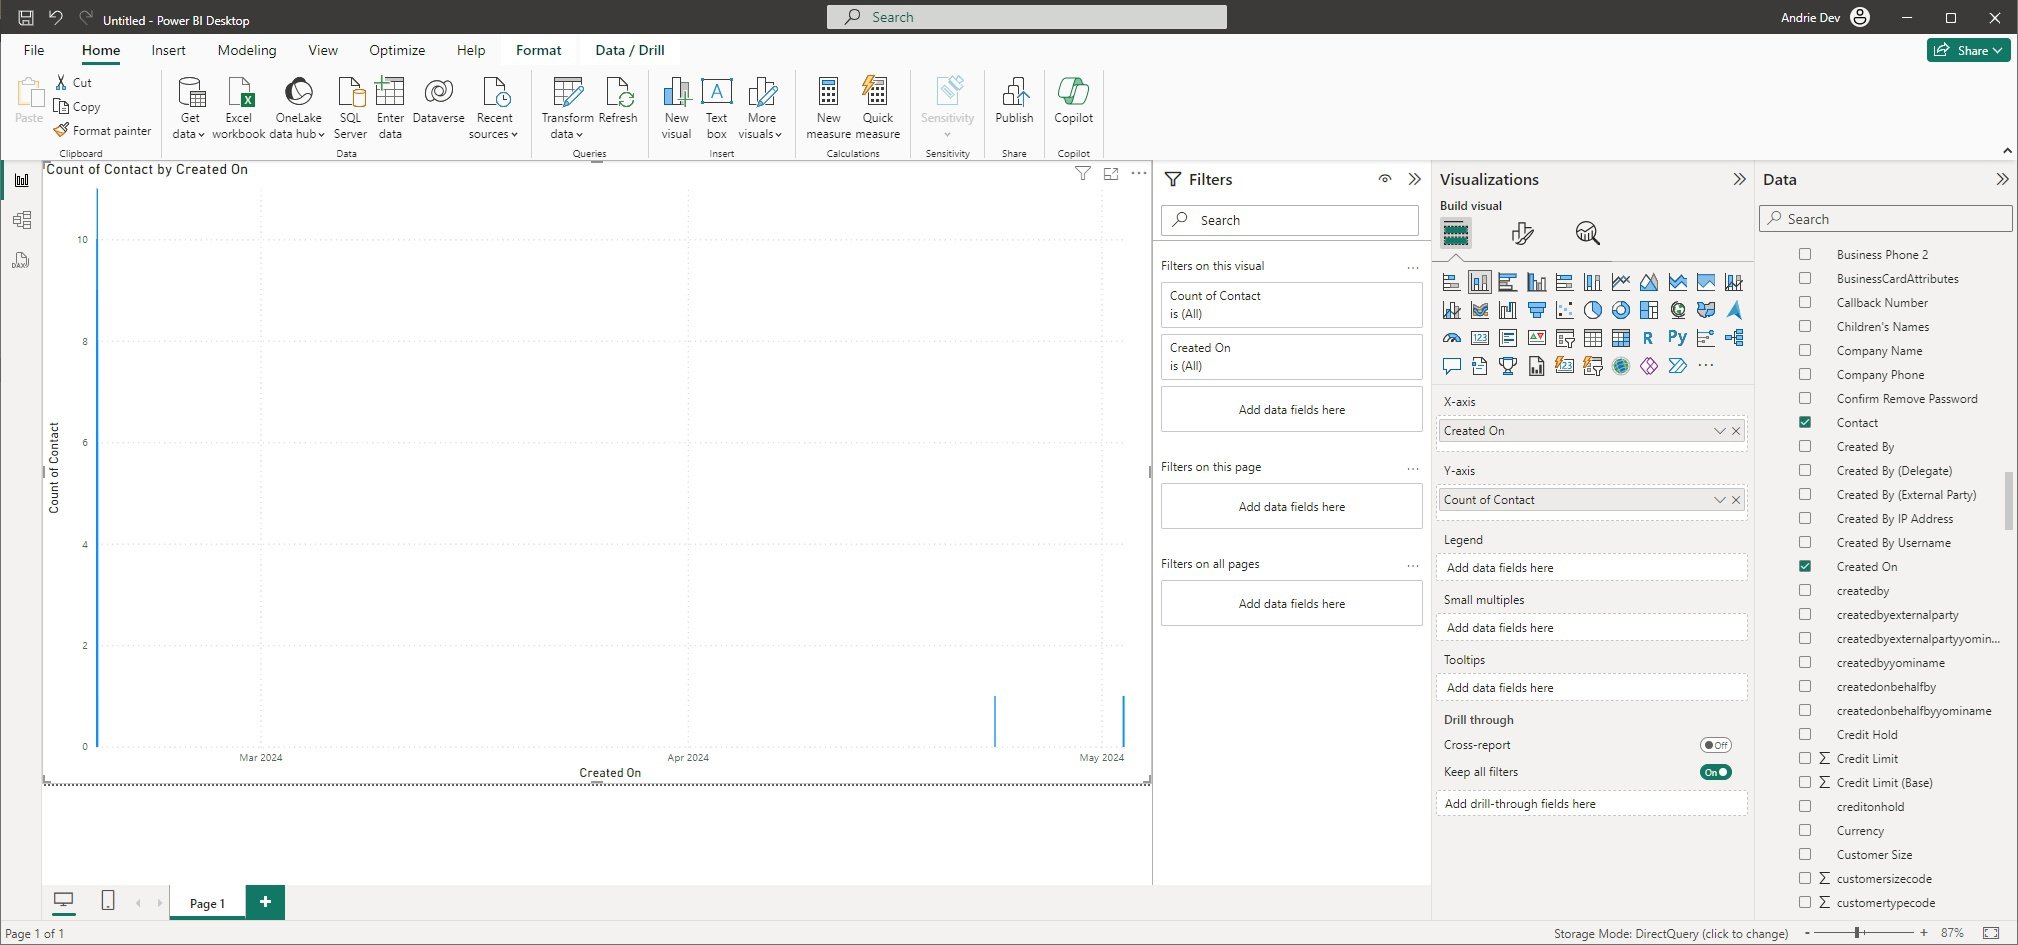
In this demo CRM almost all contacts were created long ago and only 3 contacts were created recently.
To filter out "old contacts," expand the Created On filter, change the Filter type to Relative date, and select the "is in the last 7 days" value.
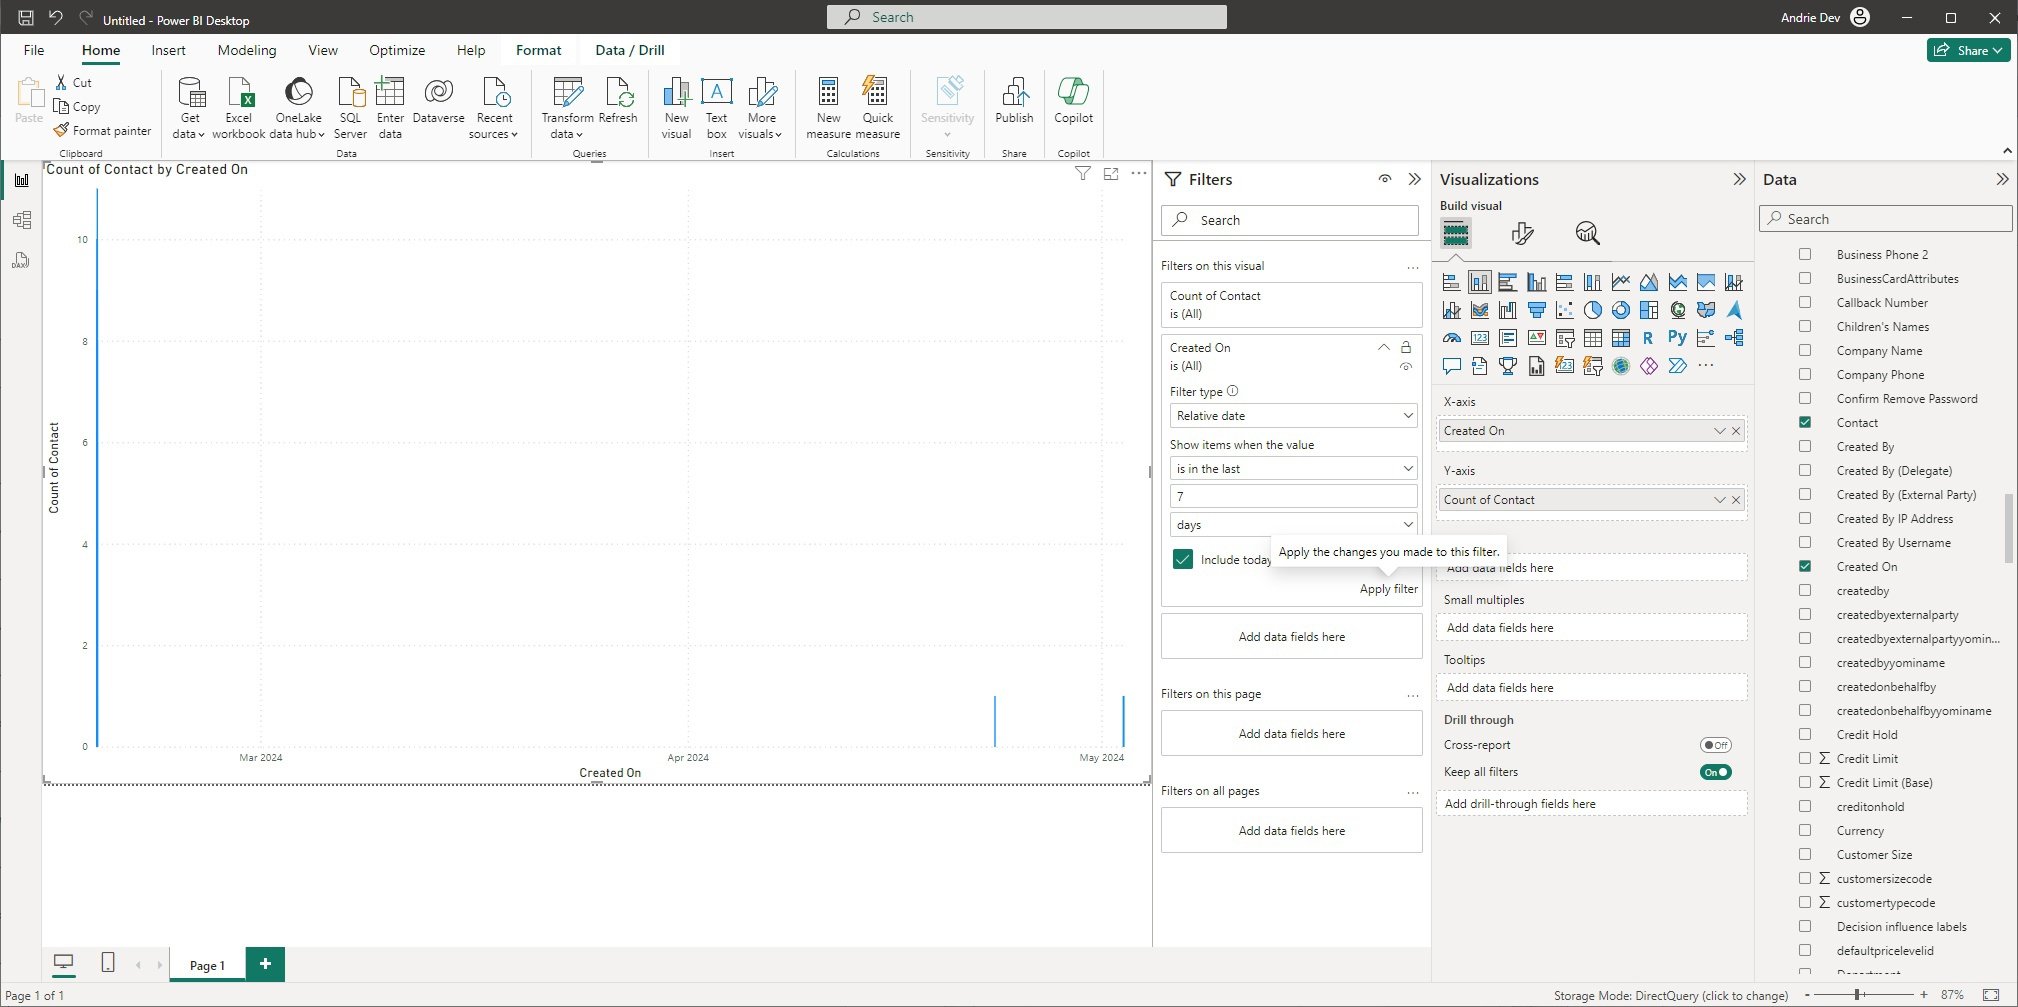
After you click on the Apply filter, your data will be refreshed, and the report will be displaying the requested data.
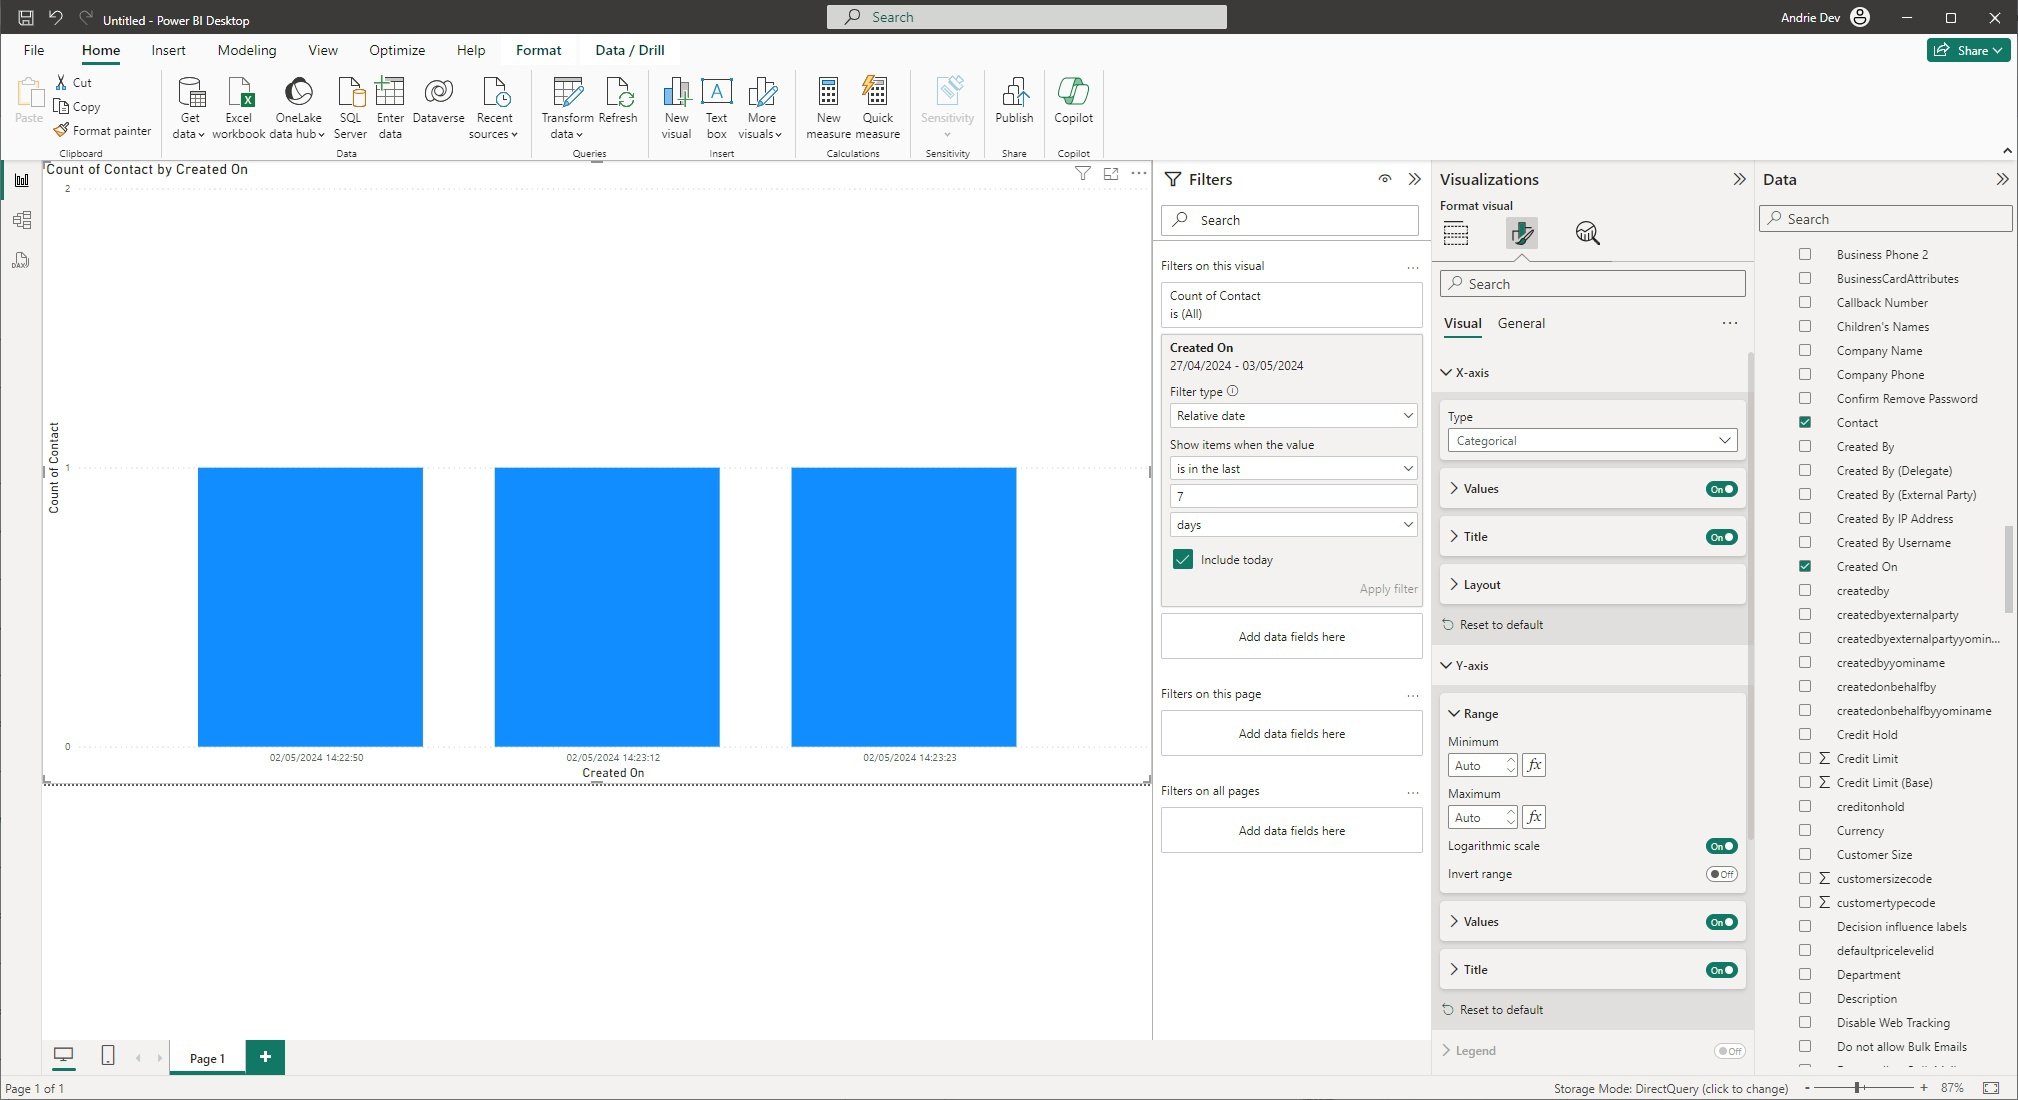
As you can see, the data on the X-axis represents a series of timestamps, even if no Contacts were created at this time. Y-axis also requires modification because this count includes decimals. To make your report more polished, in the Visualization column of your report, switch to the Format tab, expand the X-axis item and change Type to Categorical, expand the Y-axis and turn on the Logarithmic scale option.
After automatic data refresh your report design should be looking like this:
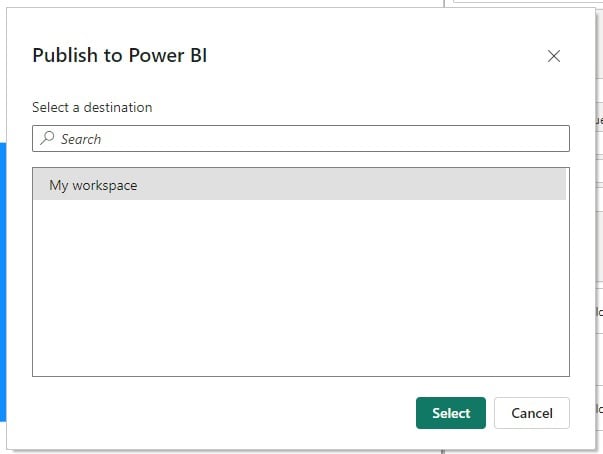
If you are ok with the result, to save this report, we need to publish it by clicking on the Publish button at the top ribbon (second from the end on a previous screenshot).
You will be asked to save the report locally first. After that you need to select a Power BI workspace to save this report online. If you are not sure what workspace you need to use, I recommend visiting app.powerbi.com and creating a new workspace (in my case, I'm using the default "My workspace" option).
After publishing is finished, you need to open app.powerbi.com and visit "My workspace." You will see the model (Contacts table) on which your report is based and the report itself.
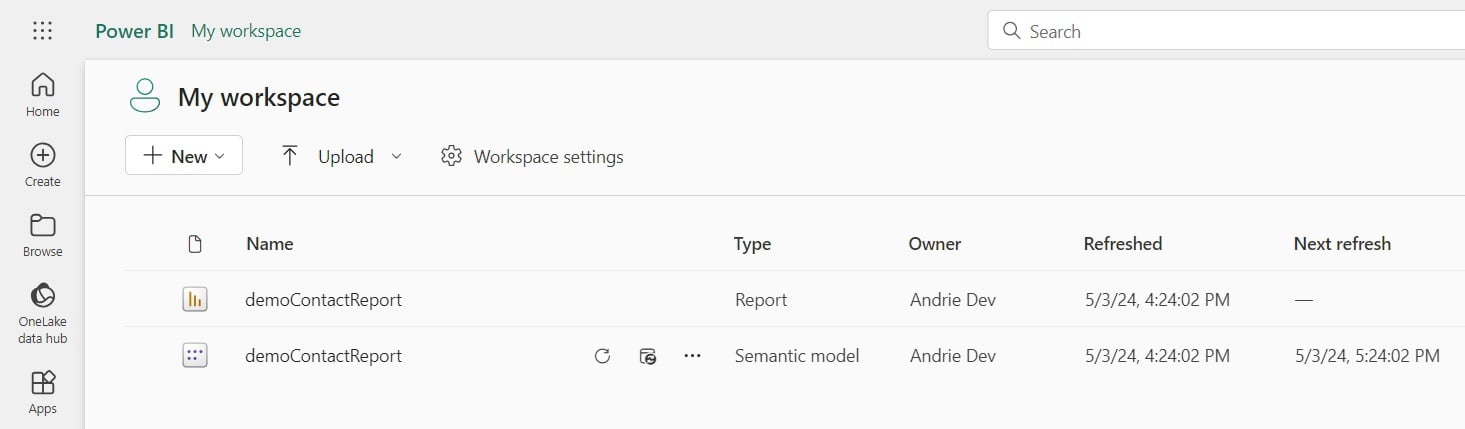
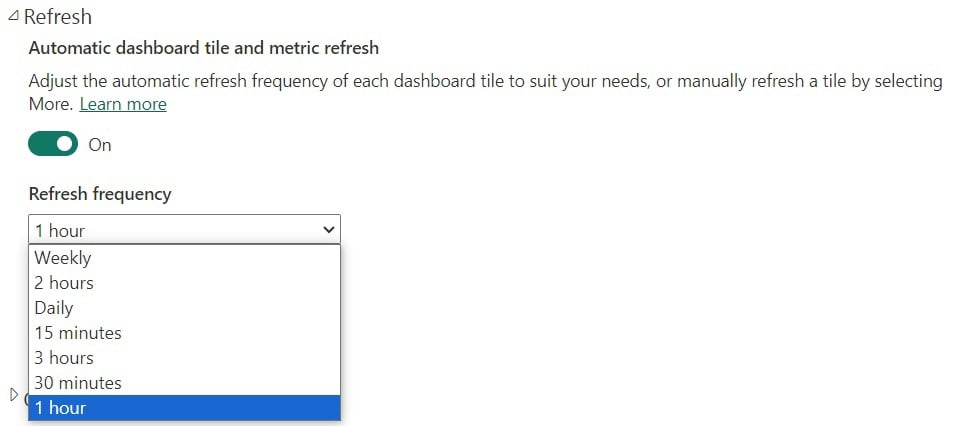
By default, model data is refreshed every hour, but you can update the refresh frequency in the model settings (Hover mouse over model > Click on three dots > Select Settings.)
That's it, your report is done :-)
Report Sharing
Now you need to share your newly created report with your manager.
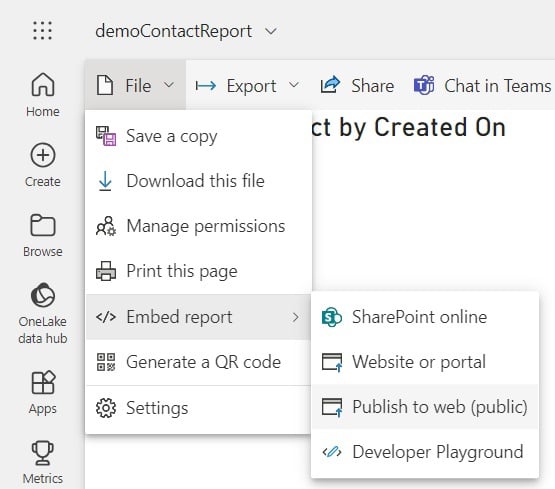
In my experience, managers usually use Power BI reports not only on their work laptops but also often share them with people outside of the organization. That's why I usually use the following sharing option: while you are on the app.powerbi.com page, open your report by clicking on it. After that open the File dropdown, go to the "Embed report" menu, and select the "Publish to web (public)" option.
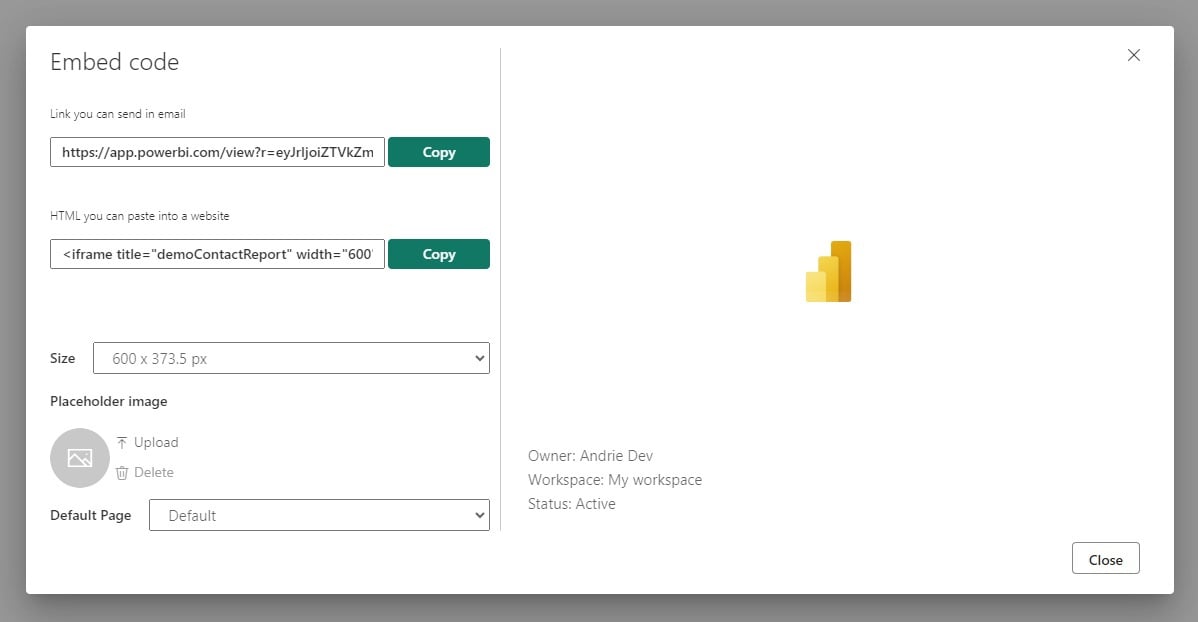
In the next window you will get two codes. The first one is the best option if you want to send it to the manager and the manager will be looking at the data by clicking on this link. The second one contains a ready to use HTML code to embed this report to a webpage. No login is needed for any of these options.
Final Notes
The current report represents a very simple entry-level implementation, providing a solid starting point for your Power BI journey. As you progress, consider enhancing the report by incorporating features such as a date slicer or tracking the top creators of contacts. These additions can further refine your insights and drive actionable decisions within your organization.
Summary
As we conclude this walkthrough, you've witnessed the seamless integration of Power BI and Microsoft Dynamics 365, unlocking a wealth of insights for your business. Throughout this guide, we've emphasized the importance of bridging the gap between data and decision-making.
By leveraging Power BI visualization capabilities alongside Dynamics 365 functionalities, you now possess the tools to harness your data assets fully. From connecting Power BI to D365 CRM to sharing reports effortlessly, this walkthrough has equipped you with the knowledge to navigate the data-driven era successfully.
Moving forward, remember that this integration isn't just about technology — it's about empowering your organization with the insights needed to thrive. By seamlessly integrating Power BI reports into your Dynamics CRM dashboards, you can provide a comprehensive view of your data and facilitate informed decision-making at every level.
Thank you for embarking on this journey with us. If you have any questions or need further assistance, please reach out. We're here to help you unlock the full potential of your data.