

Introduction
This article will present the results of an investigation into 300 websites built using Microsoft Power Pages technology. Microsoft Power Pages allow businesses to create websites in a low-code manner while integrating their data with Dynamics 365 and other applications. It benefits scenarios like employee portals, personal cabinets, suppliers, educational portals, etc. In these situations, you often need to merge complex data structures managed by internal users with features for external parties.
For external parties using these portals, it's crucial that they are user-friendly, intuitive, and perform well. In this article, we'll explore the load speed of the main page from nearly 300 real-world implementations of Microsoft Power Pages technology.
Throughout this article, we will cover:
• Performance assessments of 300 portals with the help of Google PageSpeed Insights.
• Two common mistakes that impact performance, along with general insights.
• A comparative analysis of the performance of Microsoft DataCenters in hosting those portals.
• A Microsoft Power Pages website with near-perfect performance scores for both desktop and mobile.
Methodology
We tested 300 Microsoft Power Pages websites using PageSpeed Insights. While PageSpeed Insights can evaluate various metrics, we focused on one specific measure: page load speed on both desktop and mobile devices. This metric ranges from 0 to 100, 100 representing the ideal score. Additionally, PageSpeed Insights provides suggestions for optimizing the portal's load speed.
PageSpeed Insights embodies Google's methodology for assessing website usability, which can subsequently influence a website’s ranking in search results. Although Google SEO may not be a priority for many Microsoft Power Pages websites, given their specific use cases, the tool offers a reasonable estimation of the performance aspect of user experience with the portal.
It's worth noting that PageSpeed Insights simulates a single user session, capturing every phase of page loading. It doesn't serve as a performance or penetration test. Other tools are necessary for those types of tests, and such testing was not within the scope of our current investigation.
Results
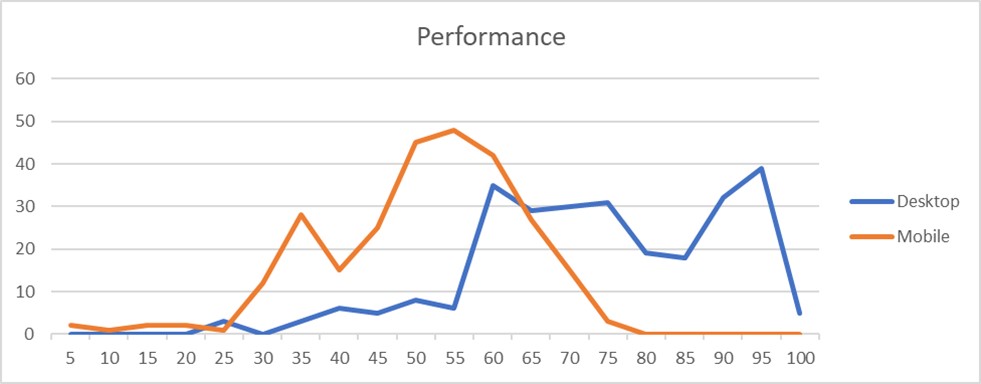
Let's examine the results. The X-axis displays performance scores ranging from 0 to 100. The Y-axis shows the number of websites with corresponding scores. Most websites scored 55 or higher in the Desktop category, indicating a varied performance. It suggests that website speed varies based on implementation rather than technology (in this case, Microsoft Power Pages). High performance is attainable in many cases. However, the mobile category tells a different story. Most sites scored 45-65, hinting that Microsoft Power Pages might struggle on lower-performing mobile devices.
Upon delving deeper into the performance results, PageSpeed Insights identified the following prevalent issues on the lower-performing websites:
• Inefficient Image Usage: Many websites deploy oversized or unoptimized images. Some are poorly formatted but can be refined without compromising quality. It leads to longer page loading times, especially on mobile.
• Bulky Third-Party Scripts: Several sites incorporate heavy third-party scripts. These exacerbate delays caused by the already heavy PowerApps scripts. Addressing these two concerns alone could elevate the performance of many portals into the 70-90 range. We'll delve deeper into specific recommendations in our subsequent article. If needed, don't hesitate to reach out to us for expert consultation.
Beyond these general suggestions, we identified issues unique to Power Pages, some of which might not have straightforward solutions:
• Power Pages often show data from Dynamics 365 or Dataverse. To create content, they need to pull this data. Load speeds can be affected by cache settings and complex data requests, so it's vital to optimize and test these queries.
• Power Pages include built-in scripts from the platform. These scripts are a major reason for the average performance seen on mobile devices.
DataCenter Performance
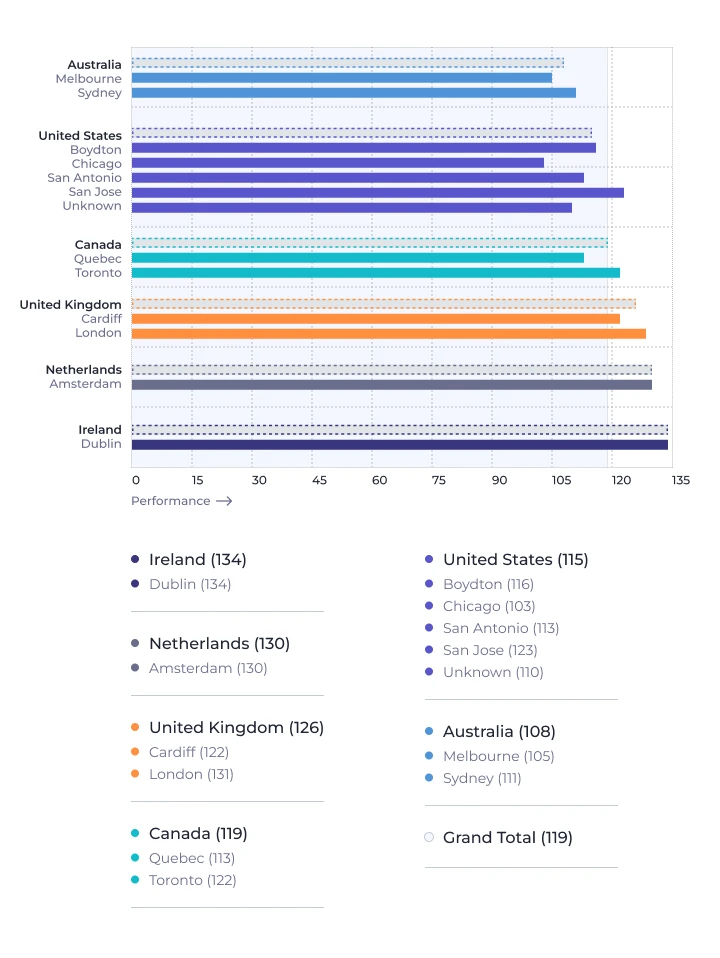
As part of our investigation, we also explored which Data Centers are used to host Microsoft Power Pages and assessed their relative performance. We utilized specific Google data centers closest to the Data Center under examination to test performance. We excluded Data Centers hosting fewer than ten websites to ensure our data was representative. The results are shown below, with the performance metric calculated as the combined average of both mobile and desktop performance.
Top Performing Portal
We discovered a portal that scored 100 in both categories during the investigation. It surprised us, as even the most straightforward implementation would require at least Power Pages scripts, limiting performance. Our team was eager to uncover the secret behind this implementation and learn from the performance gurus who completed the project. Unfortunately, our excitement was short-lived. You can understand why by clicking the button below.
The reason was straightforward: the website was under maintenance, displaying a simple maintenance image on the homepage :/.

Conclusion
If you plan to implement a portal for diverse users across various devices, especially low-end ones, carefully selecting the platform is crucial. This challenge isn't exclusive to Power Pages and affects many frameworks. However, the Power Apps Portal can deliver solid performance on desktops and high-end mobile devices with stable internet connections when properly configured. This scenario aligns with the typical use case for the technology.
Companies should prioritize optimizing their portals to ensure the best user experience regarding both UX and performance. With extensive expertise in this area, our company excels in enhancing such platforms in our projects. Please feel free to contact us if you want to audit your Microsoft Power Pages or Dynamics 365 implementation.